Multiple Hypothesis Testing
STA35B: Statistical Data Science 2
library(tidyverse)
options(pillar.print_min = 9)  # to avoid annoying scroll behavior
knitr::opts_chunk$set(out.height = "100%")
theme_set(theme_bw() + theme(axis.text = element_text(size = 14),
                             axis.title = element_text(size = 16),
                             ))
Other common sayings
- A broken clock is right twice a day.
- Torture the data until it confesses.
Motivating Example: Suppose a researcher compares 20 outcomes between a treatment and control group:
- anxiety score, sleep quality, blood pressure, cholesterol, concentration, and 15 more
For each outcome, they test at \(\alpha = 0.05\).
- If nothing truly differs, how surprising is one “significant” result?
One Test vs. Many Tests
If all \(m \geq 1\) null hypotheses are true and all \(m \geq 1\) tests are independent:
\[
P(\text{no false positives}) = (1 - \alpha)^m\\
\Longrightarrow P(\text{at least one false positive}) = 1 - (1 - \alpha)^m
\]
False Positive Risk With \(\alpha = 0.05\):
| 1 |
0.05 |
| 5 |
0.23 |
| 10 |
0.40 |
| 20 |
0.64 |
| 100 |
0.99 |
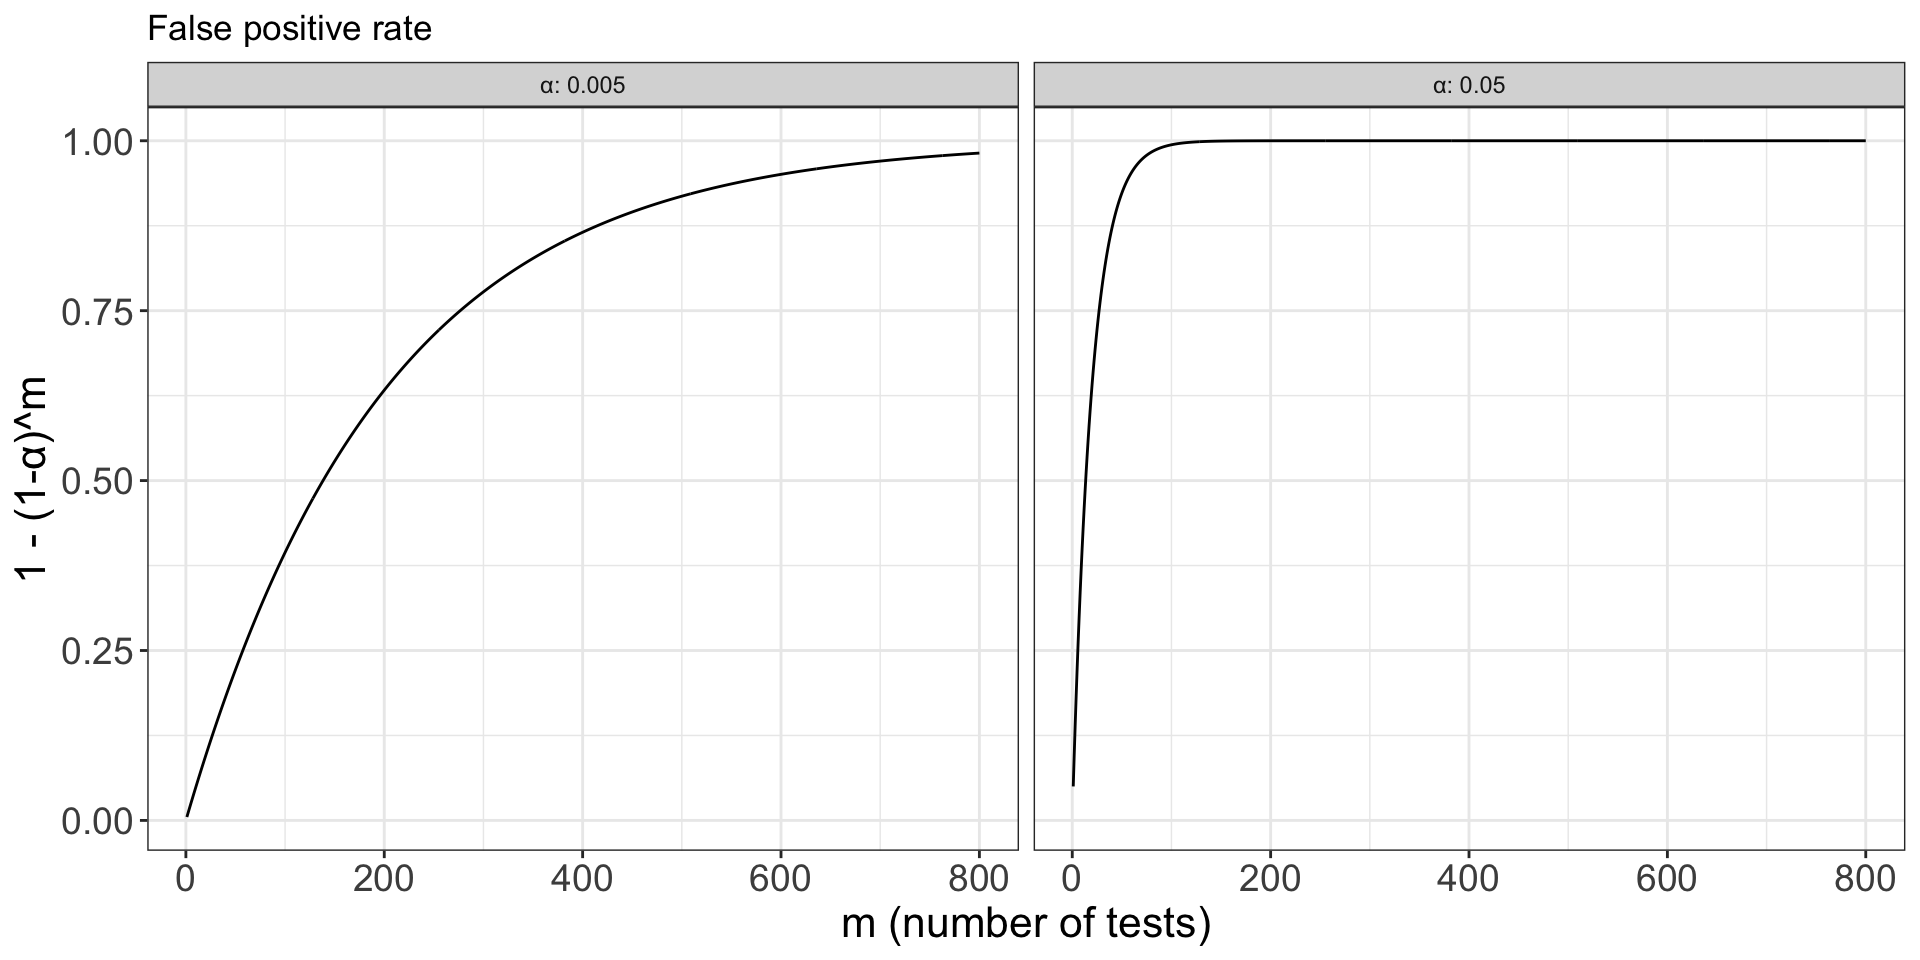
a_vec <- c(0.05, 0.005)
m_vec <- 1:800
fpr_fun <- function(m, a) 1 - (1-a)^m
my_df <- lapply(1:2, \(i) {
    data.frame(α = a_vec[i], num_test = m_vec, false_positive_rate = sapply(m_vec, fpr_fun, a=a_vec[i]))
}) |> purrr::reduce(rbind)
my_df |>
    ggplot(aes(num_test, false_positive_rate)) +
    geom_line() +
    facet_wrap(~α, labeller='label_both') +
    labs(x='m (number of tests)', y='1 - (1-α)^m', title='False positive rate')
The problem is not a bad test. The problem is repeated opportunity for a false positive.
The Language of Multiple Testing
A family is the collection of tests we want to treat as one inferential unit. E.g.,
- all primary outcomes in a clinical trial
- all pairwise group comparisons in an experiment
- all genes tested in an expression study
- all A/B metrics used to decide whether to ship a feature
Three Error Rates
| Per-test error rate |
How often does each individual test falsely reject? |
| Family-wise error rate |
How often do we make at least one false rejection in the family? |
| False discovery rate |
Among rejected hypotheses, what fraction are false discoveries on average? |
Bonferroni Correction
If testing \(m\) hypotheses \(H_1, \ldots, H_m\) and you want FWER \(\le \alpha\):
\[
\text{reject } H_i \text{ if } p_i \le \frac{\alpha}{m}, \qquad i=1,\ldots,m
\]
Example: Five outcomes are tested with \(\alpha = 0.05\).
- To ensure that FWER \(\le \alpha\), we will
\[
\text{reject } H_i \text{ if } p_i \le \frac{0.05}{5}, \qquad i=1,\ldots,5
\]
| 1 |
0.001 |
reject |
| 2 |
0.012 |
fail to reject |
| 3 |
0.019 |
fail to reject |
| 4 |
0.041 |
fail to reject |
| 5 |
0.200 |
fail to reject |
Why does this ensure that FWER \(\le \alpha\)? If hypotheses \(H_1, \ldots, H_{m_0}\) are true, then
\[\begin{align}
\text{FWER }
&=\; P(\text{at least one Type I error in the family})\\
&=\; P\bigg(\bigcup_{i=1}^{m_0} \Big[p_i \leq \frac{\alpha}{m}\Big]\bigg)\\
&\leq\; \sum_{i=1}^{m_0} P\bigg( p_i \leq \frac{\alpha}{m}\bigg)\\
&\leq\; \sum_{i=1}^{m_0} \frac{\alpha}{m}\\
&=\; m_0 \frac{\alpha}{m}\\
&\leq\; \alpha.
\end{align}\]
(We don’t even have to know what \(m_0\) is.)
False Discovery Rate
The false discovery rate is the expected fraction of discoveries that are false:
\[
FDR = E\left(\frac{\text{false rejections}}{\text{all rejections}}\right)
\]
- FWER asks: Did we make any false discovery?
- FDR asks: How noisy is our list of discoveries?
When FDR Makes Sense
FDR is common when:
- many hypotheses are tested,
- follow-up studies are possible,
- a short list of candidates is useful,
- missing real effects is also costly.
Examples:
- genomics
- brain imaging
- large-scale survey analysis
- exploratory product experiments
Comparing the Methods
| No adjustment |
per-test error |
single planned test |
false positives accumulate |
| Bonferroni |
FWER |
high-stakes confirmatory testing |
conservative |
| Holm |
FWER |
confirmatory testing with more power |
slightly more complex |
| BH |
FDR |
large-scale discovery |
allows some false discoveries |