1 About this course and R
STA141A: Fundamentals of Statistical Data Science
Some announcements
Homework is due in seven days (M Apr 6)
New ADA Rule on Digital Accessibility (compliance deadline April 24).
I will not add students off of the waitlist (the other instructor’s sections might have open seats).
What is the course about? – The model of data science
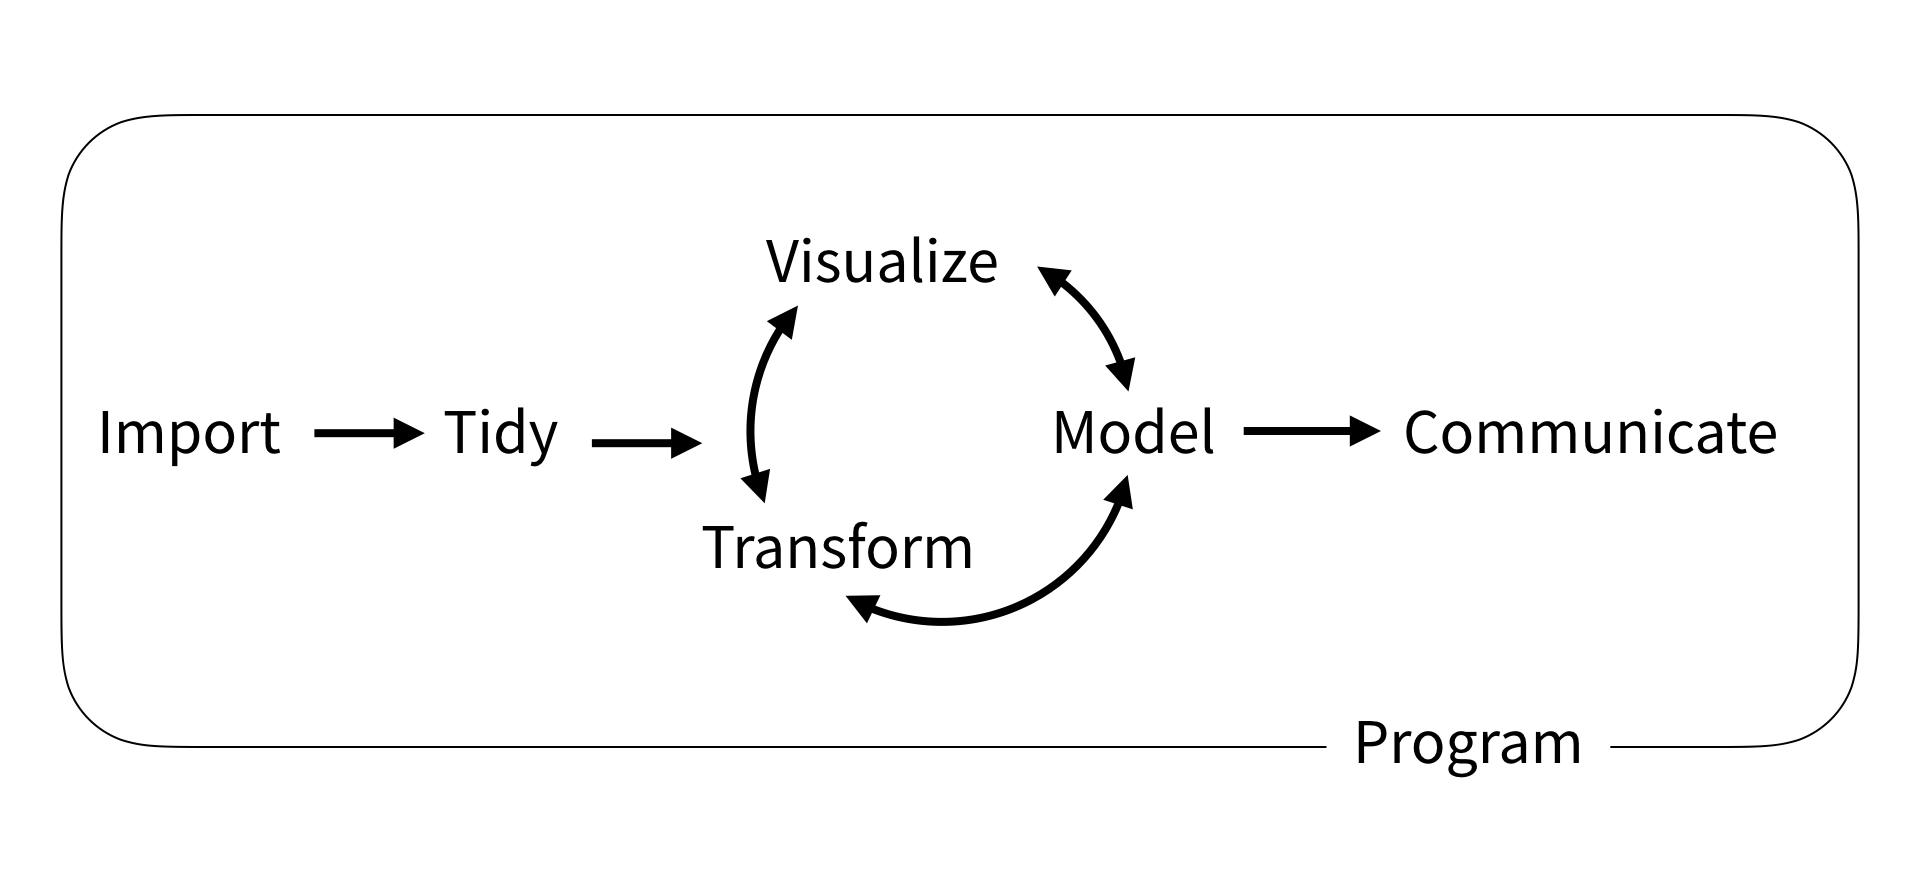
The whole game. Wickham and Grolemund (2017)
\(\Rightarrow\) We want to do this with R
Programming
General comments
Surrounding all the mentioned tools is programming.
- Do not need to be an expert programmer or data scientist.
- However, learning more about programming can help you automate and simplify common tasks.
In this class we will learn...
... general programming concepts;
... visualize our results;
... statistical programming, computation techniques for data analysis/statistics purposes.
Key high-level programming concepts
Data Objects (vectors, arrays, matrices, lists, data frames, etc.)
Operations (vector arithmetic, selecting and modifying, element-wise operations, matrix multiplication, matrix decompositions, etc.)
Control statements (conditional execution, repetitive execution, etc.)
Functions (built-in functions, writing own functions)
Data manipulation (how to manipulate/transform data frame objects)
Data visualization
About R
Why R?
R is a programming language and software for statistical computing and graphics. It provides a wide variety of statistical (linear and nonlinear modeling, classical statistical tests, time-series analysis, classification, clustering, …) and graphical techniques.
Easy to learn and to use.
R can be used to generate graphics based on complex data sets very quickly.
Very popular and one of the standard languages for statistics, data science, computational biology, finance, industry, etc.
New technology and ideas often appear first in R.
Supported by a vast community that maintains and updates R.
A lot of high quality packages.
Free and open-source.
Runs on basically any platform.
What is the effect of learning R?
Learn general concepts of high-level programming and languages.
Since R is a complete programming language, learning it allows you to transfer the concepts to other languages.
Syntax and available libraries may differ between languages, but how you approach a computational task and reason about the computations is similar.
It enables you to learn another programming language much easier.
R libraries/packages
R is divided into:
The base R system
This contains, among other things, the base package which is required to run R, and the most fundamental functions.
The ‘base’ system contains also some other packages.
In about 20,000 libraries (or packages) that you can install and use:
CRAN ‘contributed’ packages (or sometimes in BioConductor project or in Github repositories).
These already do pretty much anything you have in mind (data manipulation, advanced visualizations, machine learning models, etc.).
Integrated Development Environment (IDE)
R console has basic functionality. Typically want to use an IDE.
An IDE is an application that enables programmers to consolidate the different aspects of writing a computer program by combining common activities of writing software into a single application: editing source code by syntax highlighting and autocomplete, debugging.
An IDE makes it easier to interface yourself with R, and comes with extra functionalities.
The company Posit offers some of its products for free, including the IDEs:
Make sure you can run R and an IDE from a machine you have access to.
Computing
RStudio can also be accessed with mobile devices using jupyter hosted by UC Davis. Further useful links are the following:
CRAN vignettes (The Comprehensive R Archive Network)